

It is not lost on me that I am contributing to the problem of overreacting to the initial NET rankings by writing an article about it. But, the NET is a crucial piece of the NCAA Tournament selection puzzle, and thus its starting point warrants at least some discussion.
From an individual team standpoint, it is better to be rated higher than lower in the initial rankings — obviously — but the initial NET rankings have not been super predictive in the past. After all, the NET is created to be as close to "accurate," for lack of a better term, on Selection Sunday.
30 of the top 40 teams in the initial NET rankings last year, released on Dec. 1, went on to make the NCAA Tournament. A high rate, for sure, and a good sign if your team ranks there, but a lower conversion than other metrics like KenPom; 34 of the top 40 teams on KenPom as of Dec. 1 last year earned Big Dance invitations.
With league play starting soon, though, perhaps conferences more than teams are jostling for positions. With that in mind, let's dive into how each league is stacking up, an updated metrics-only bracketology, and evaluate some outliers.
Where are bids starting to funnel to?
High-major leagues (SEC, ACC, Big Ten, Big 12, and the Big East) are always going to soak up the majority of the at-large bids, but the distribution of bids among those five differs from year-to-year. Last season, for instance, the SEC led with 14 bids while the Big Ten (8), Big 12 (7), Big East (5), and ACC (4) lagged behind.
Although early, the SEC again looks to be in the best shape as far as number of teams competing for bids. League size (16 teams) contributes, but they lead high-major leagues in average NET ranking, average NET ranking of top-half teams, and hold the highest percentage of teams ranking in the top-25 and top-50.
Only one SEC team ranks in the top 10 but five rank between No. 11 and No. 22.
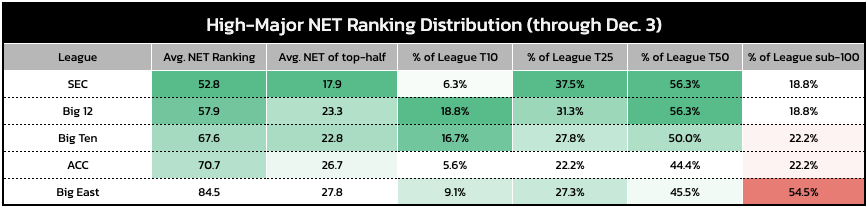
In terms of top teams, the Big 12 and Big Ten hold the somewhat-arbitrary early advantage, with both leagues also having solid depth. As it stands, those appear to be the "Big 3" leagues gearing for the majority of at-large bids. The ACC lags behind that group but is in a much better place than the Big East with regard to depth.
While UConn (NET 8), St. John's (NET 18) and Butler (NET 23) give the Big East a comparable percentage of its teams ranking in the top-25, over half of the conference ranks sub-100. If that number doesn't improve by the time league play is fully underway, there will be a much higher percentage of opportunites for landmine losses than quality wins — not an ideal equation for its potential down-the-road bubble teams.
What about the mid-major leagues?
Outside of the power conferences, the familiar faces of the Mountain West, Atlantic 10, and West Coast loom as the main contenders to be multi-bid leagues. The upper-half of each league averages ranking in the top 75 nationally, though even the Atlantic 10's top-half teams are substantially below those of the Big East.
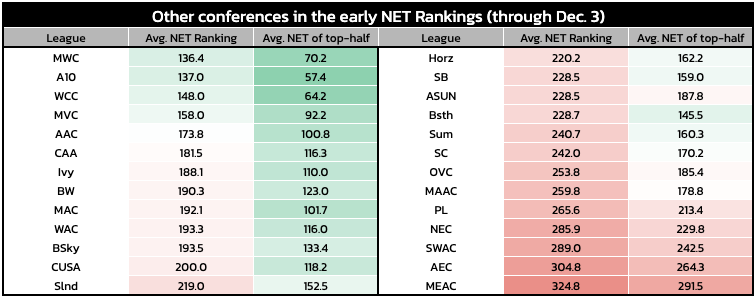
Using NET rankings of the top half of a mid-major league isn't the best indicator of multi-bid potential, though; it was just the easiest to chart for consistency. Those rankings can be dragged down by a steep drop-off after the top teams in a league. The WCC, for instance, features three at-large hopefuls with top-40 NET rankings (Gonzaga, Saint Mary's, Santa Clara) but still has a sub-60 top-half average.
Additionally, lower rated leagues can earn two bids by having one dominant presence worthy of an at-large fall short in their conference tournaments. Without many opportunities for low- or mid-majors to make substantial moves up the NET rankings during their conference seasons, though, posting a strong initial ranking might be mandatory for potential at-larges. From the broad perspective of initial NET rankings, teams like Yale (NET 36), Akron (NET 43), William & Mary (NET 50), UC San Diego (NET 57), and McNeese (NET 61) have laid groundwork if they can play well enough over the next couple of months.
Updated *metrics-only* bracketology field
The NET (and thus the associated WAB rankings) release completes the puzzle of teamsheet metrics. The other core metrics on the NCAA Tournament selection committee's teamsheets – KPI, SOR, BPI, KenPom, and T-Rank – have already been out and available since the beginning of the season.
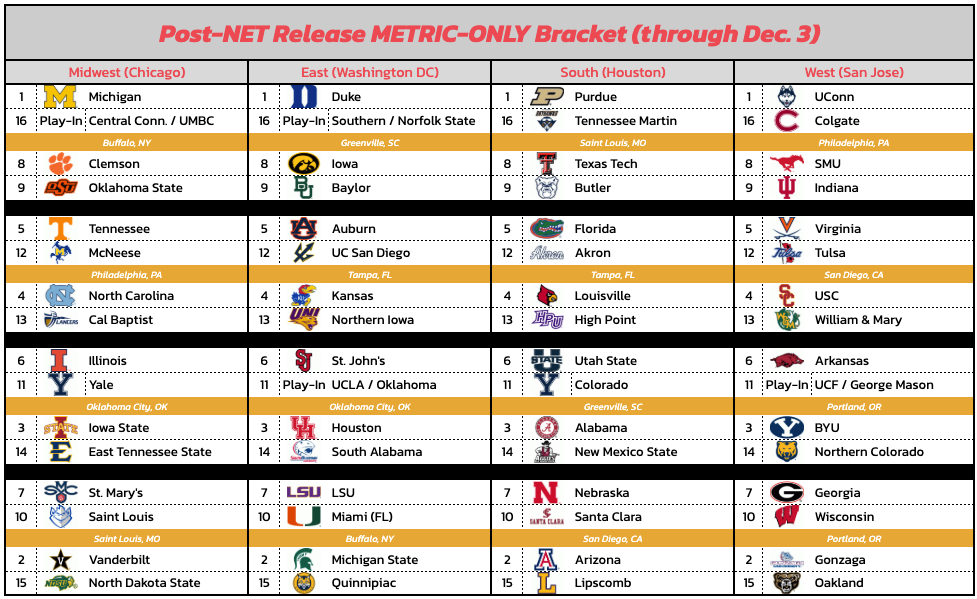
Quadrant records are also technically now available as a byproduct of the NET release, but it feels too early to really judge resumes from that perspective. However, the metrics at our disposal can again give somewhat of a baseline as to where teams stand before we get into fully fleshed-out resumes in a month or two.
In the preseason, I compiled a raw average of Bart Torvik and KenPom's baseline rankings to put together a field built on metric baselines (here). Now armed with the NET, WAB, KPI, SOR, and BPI as added metrics, here is where things stand – from a metrics-only standpoint, without any tinkering from me except for bracketing:
Who are the most notable outliers?
Having gone through the process of averaging the teamsheet metrics, especially with their relativity to the NET, a few outliers popped out. Namely, these are teams whose either performances have not matched their results, or vice versa, or they have played a strength of schedule that is difficult to decipher placement:
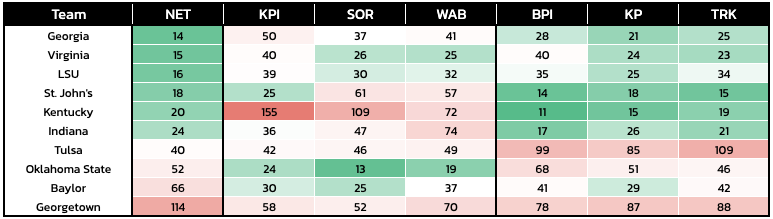
It will be interesting to track which direction some of these teams go in the coming months. For instance, Kentucky is ranked in the top-20 across the NET and all three quality metrics (BPI, KP, TRK) but missed the above metrics-only projected field due to sub-100 rankings in two of three resume metrics (KPI, SOR, WAB). That won't be the case for long as, in theory, all seven metrics will start to agree with each other with more results.
Typically, results-based metrics are more likely to catch up with predictive numbers as the season wears on. This early in the season, though, sites still have some preseason baselines involved that can sway that assumption, so be wary.
