

After breaking down a handful of different strategies and outlines to analyze player stats on KenPom.com earlier in the month, part two of this series will dive into the different elements of the website's team scouting report section.
The two elements I won't address directly are the "Miscellaneous Components" that are simpler stats and referenced many times throughout the article, and "Strength of Schedule" which is extremely straightforward and just a calculation of average opponent efficiency.
Efficiency and Tempo
Four of the five elements under the efficiency and tempo section are quite simple to understand. A team's adjusted offensive and defensive efficiency on KenPom are just their net points scored and allowed per 100 possessions, with adjusted weights including the quality of opponent, where the game is played, and when it was played. Tempo is even simpler, just the average amount of possessions a team plays in each contest.
Breaking down average possession length is where things get very interesting. Offensive possession length is much easier to understand than on the defensive end. Cal Poly and William & Mary were both top three in offensive possession length and in transition possessions per game. Drake was last by far in offensive possession rate and third-last in transition. But assessing defensive possession length is a whole different ball game.
Whereas offensive possession time typically dictates a team's intentionally desired pace, the defensive possession time can often diagnose a team's ability to control the performance of their opponent. Jon Fendler's article at Dictate the Pace does a tremendous job of detailing this concept in detail with proprietary stats, but we'll attempt to break this down using largely what KenPom gives us.
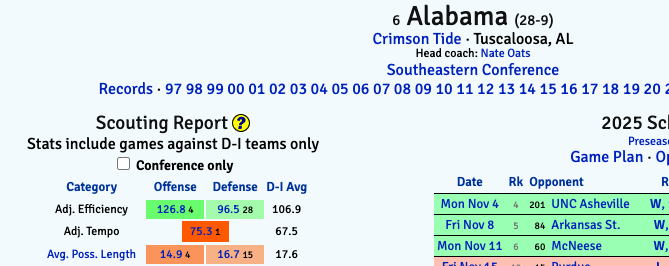
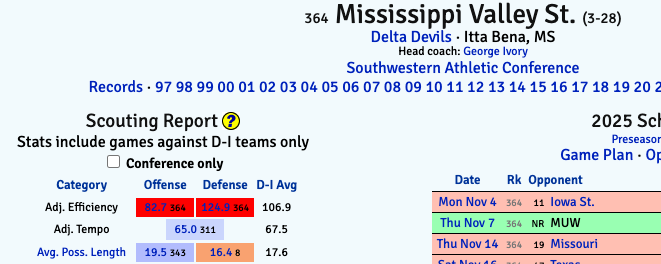
As an extreme example, we'll compare one of the worst teams in KenPom history with Mississippi Valley State, and Elite Eight team Alabama. It's long been known that Crimson Tide head coach Nate Oats wants to play extremely fast, and his teams have been Top 15 in tempo each of his six seasons in Tuscaloosa. In order to truly play at a breakneck pace, Oats' teams will willingly allow early shot-clock attempts, but do so in a deliberate manner. They don't speed up the game by pressing (64 total possessions last season), or by allowing tons of transition attempts (23rd% transition rate defensively). Instead, they'll allow teams to execute possessions like this one.
Alabama has absolutely no pressure on Texas A&M's Zhuric Phelps in the backcourt, doesn't put any pressure on the pick-and-roll, and big man Cliff Omoruyi doesn't step up on the drive. The result? A 10-second possession, only four of which occurred in the halfcourt, resulting in an air-balled off-balanced floater by the second-worst true shooting percentage guy in the SEC. That 94-88 Alabama win was Texas A&M's fastest contest of the season, and the Aggies' starting backcourt of Phelps and Manny Obaseki finished the game 10-30 from 2, and 1-6 from 3.
On the flipside, Mississippi Valley State had no interest in playing fast. They were bottom-25 nationally in offensive tempo, but just had no ability to stop their opponent from doing whatever they wanted with the ball in their hands.
Like the Alabama/Texas A&M play, Prairie View A&M's possession lasts about 10 seconds, four of which coming in the halfcourt. But in this example, the pick-and-roll is poorly communicated, the on-ball guard tries to fight through two screens, neither of the screeners' defenders attempt to stop the ball, and no weak side help rotates over. The result is a wide open layup for 5-foot-9 Braelon Bush.
At this point, you're probably thinking that I just spent too much time detailing the most obvious statement in college basketball history; that Alabama is better than Mississippi Valley State. But using these two extreme examples can help us decipher a pattern in these numbers.
Of the 90 teams with the fastest defensive possession length allowed, only nine had Top 100 adjusted defensive efficiency ratings. Of those, six had extreme drop coverages, like Alabama's (more on that later). The other three were Oklahoma State (elite steal/pressure rate), Arizona State (worst defense in the Big 12), and Kentucky (sort of an outlier here). On the flipside, of the 90 slowest defensive possession lengths, 38 had Top 100 adjusted defensive efficiency ratings. In the 25 slowest defenses, the only ones ranked lower than 150 in adjusted efficiency either led their mid-major league in that stat (Campbell), played a lot of soft zone (Northern Kentucky, UMBC), or had extreme press rates with low steal numbers (Wagner, William & Mary).
If your attention span allows, here's the difference between a slow Clemson defensive possession (No. 17 in defensive rating), and a slow UMBC defensive possession (No. 355).
Watching those two clips back-to-back is almost like watching a different sport. A Clemson defender is within arms length of a Memphis ball-handler for all 30 seconds of the possession, they press up the court, and play up to cut off all action the Tigers are trying to run. On the other hand, UMBC's soft zone is sitting back and allowing Maine to deliberately pass the ball with extremely limited pressure until they find the optimal shot they're looking for.
And so, with the caveat that there are outliers in any 364-team sample, we can start to come to conclusions about team defenses by using their average possession length combined with other helpful stats.
Fast Defensive Possession Length + Bad Defensive Rating: Teams that struggle to defend and control tempo
Fast Defensive Possession Length + Good Defensive Rating: Teams that play strict, mid-range heavy drop coverage
Fast Defensive Possession Length + High Steal Rate: Teams that allow a lot of transition due to their pressure
Slow Defensive Possession Length + Bad Defensive Rating: Teams that play soft zone or press without the intention of forcing many turnovers
Slow Defensive Possession Length + Good Defensive Rating: The best defenses in the country, and the teams most likely to dictate the tempo of a game. These teams largely do something unique with ball screen coverage (hedge, pressure, switch).
Offensive Four Factors + Style Components
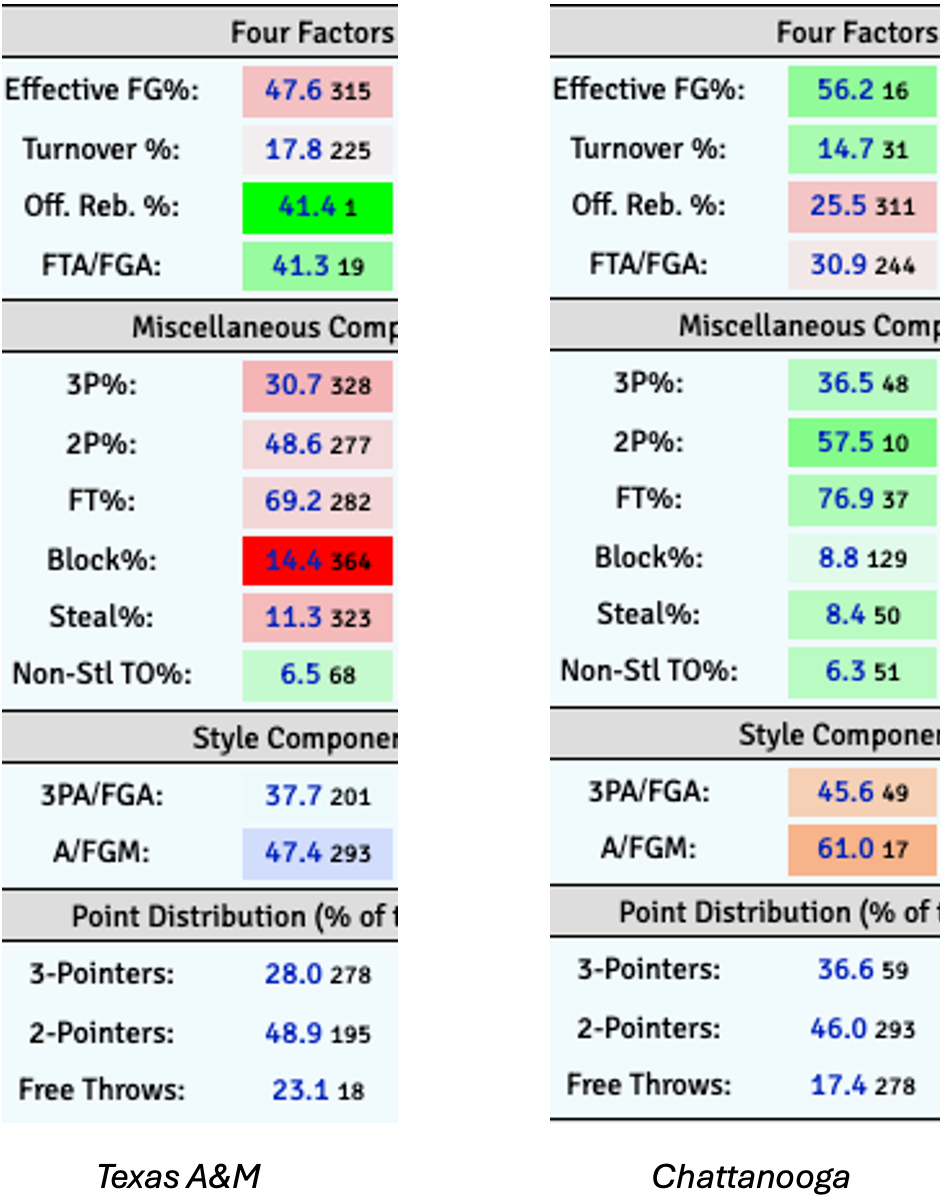
Not all offenses are created equally. But perhaps no two offenses were created more different than Texas A&M and Chattanooga. The wild part? They finished 0.1 offensive efficiency points apart, registering the exact same pace of 66.8 possessions per contest. If an opponent was set to play these two teams last year, they'd be preparing for two Top 50 offenses, but they'd have two entirely different gameplans to prepare for.
What's perhaps craziest about the dichotomy between these two offensive profiles is it's not like one is archaic and one is modern. It's not like comparing Alabama's revolutionary rim-and-3 scheme against Delaware State and their nation-leading 250 mid-range jumpers. Both squads were within 1% of each other in the middle of the pack in ShotQuality's Rim & 3 Rate statistic.
Pushing aside all the fancy stats, their KenPom profiles are easily able to indicate the variation of style between these squads. How if these offenses were trying to escape a locked room instead of score a basketball, the Aggies would try ramming the door down while the Mocs would try picking the lock, and it would both take them the exact same amount of time to accomplish it.
Only two teams were within the Top 100 in all four factors last season, Missouri and High Point. In our example squads here, they finished in the upper echelon in two factors, and the bottom-half nationally in the other two.
When it comes to Texas A&M, everything revolves around the offensive glass. They don't mind if they miss a ton of shots, which their field goal percentages all suggest they do. They don't mind if they get their shot blocked, either. Because when a team brings in over 41% of their misses, a clanked jumper is a near-50/50 shot at another attempt. Add in their 4.1 free throws for every 10 shot attempts, and there's well over a 50% chance that an Aggies possession results in a second attempt or trip to the charity stripe. In reality, the only number in the red color that is actually problematic is the steal percentage, because that represents the only time offensively that a second chance cannot be secured or foul be drawn.
For Chattanooga, their most prominent feature is their 16th-ranked assist percentage. The Dan Earl offense revolves around their big men making plays to cutting guards or off-screen shooters, which fascinatingly means that their four highest individual assist rate players were all forwards and bigs. Of course, this also means that their biggest players are nowhere near the hoop for offensive rebounds. Look at where the bigs are located in this Chattanooga possession, versus one from Texas A&M.
There is typically a pretty strong correlation between teams that shoot a lot of threes and those that get a lot of assists, at least within good offenses. Of the 50 teams with the highest 3-point rate, 60% of them were in the top 100 for assist rate. Looked at the other way, of the bottom 50 teams in 3-point rate, just 16% of them were in the top 100 for assist rate.
There's also a very interesting relationship between offensive rebounding and efficient shooting. Much like Texas A&M, who is near the very bottom in effective field goal percentage while dominating the glass, just five of the top 50 offensive rebounding percentage offenses are also top 50 in shooting. Those teams - Florida, SMU, UConn, Samford, and Auburn - won an average of 28 games last year.
While the Aggies and Mocs are two teams with exceptionally clear identities, we can use these examples to create some broad conclusions via KenPom about a team's offensive identity.
High 3-point rate, High assist rate, High 2-point efficiency: Analytical Rim-and-Three offense
High 3-point rate, Low 2-point efficiency: Jump shooting team with very limited rim pressure
Low 3-point rate, Low 2-point efficiency: Isolation and mid-range heavy offense
High free throw rate, High blocked shot rate: Extremely rim-heavy offense
Defensive Four Factors + Style Components
By far my favorite part about a KenPom team scouting report, you can largely diagnose a team's entire defensive identity and scheme just by looking at their four factors and style components. To illustrate this, we'll take a look at two of the best teams in the country last season, who were both on extreme ends of the defensive spectrum.
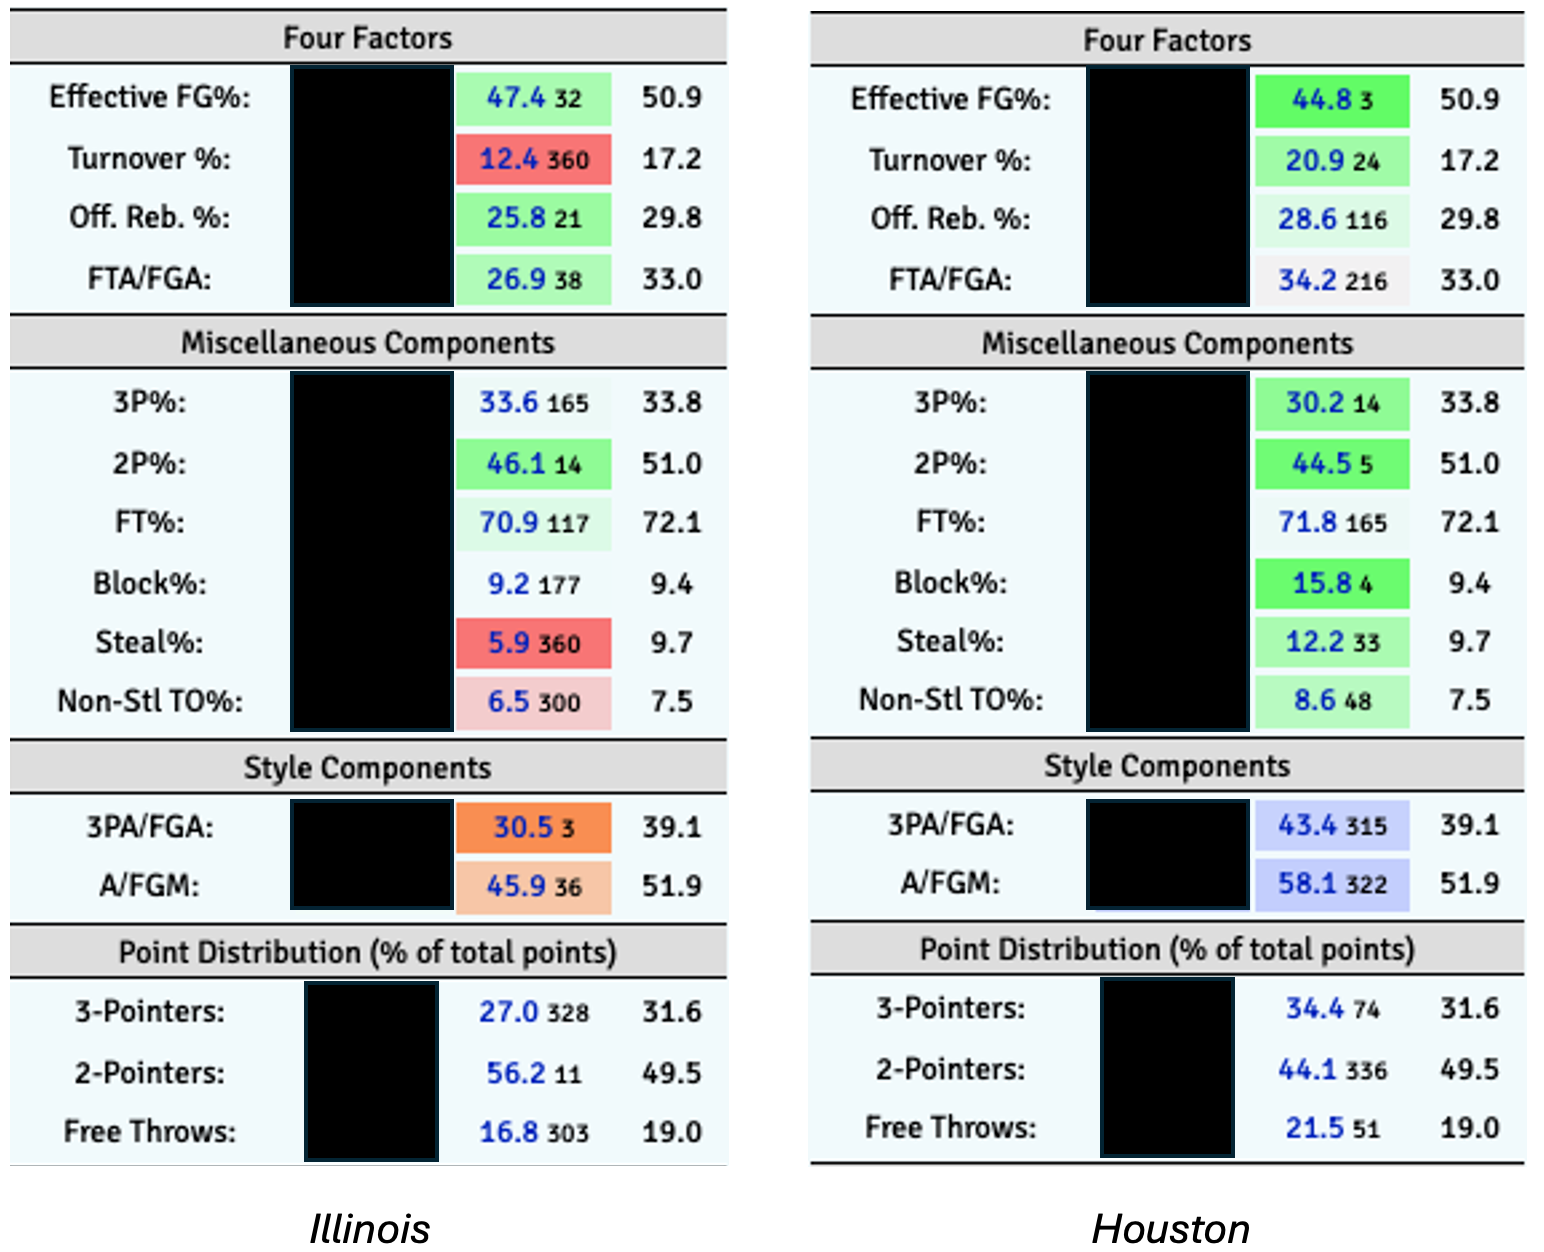
While Houston was the far better defense last season (No. 1 vs. No. 40), these were still two of the top units in the country, by implementing completely different strategies. Illinois' extremely soft drop coverage aimed to manipulate their opponents' shot profile, while Houston's exceptionally aggressive hedge defense sends two to the ball whenever an opponent tries to make a move. Here's how the two coverages play out in real time.
In the first clip, Illinois is not only completely unconcerned with Xavier's Dailyn Swain as a 3-point shooter, but they don't really bother to provide any pressure until he gets a foot into the paint. It's not like Swain was a scrub either, he was the third leading scorer on the roster. But given 113 of his 134 baskets were at the rim last season, Illinois had absolutely zero concern with any jumper he felt like taking. With 7-foot-1 Tomislav Ivisic parked in the paint begging Swain to take any other type of shot, Swain obliged with one of only 10 floaters he took all season.
In the second clip, Houston sends two to the ball on three separate occasions. At some point in the possession, big man J'Wan Roberts guards Florida's 1, 2, and 5-men. LJ Cryer starts the possession on the right side and finishes on the left, and the opposite is true for Emanuel Sharp. On just one possession, they double the ball out of star Walter Clayton's hands, double the ball out of 7-foot-1 Micah Handlogten's hands right under the rim, aggressively close out on Alijah Martin's spot-up in the corner, and rotate over to contest Thomas Haugh's bad miss from deep. It couldn't be a more different approach.
Purdue was a common opponent for Houston and Illinois last year. In the Houston game, the Cougars' relentless traps on point guard Braden Smith allowed him to take just seven shots, while forcing 19 3-point attempts from off-ball players Fletcher Loyer, Camden Heide, and Myles Colvin. In the Illinois game, the Illini's mid-range funnel drop coverage allowed Smith to take 19 shots, and Loyer, Heide, and Colvin combined to take four 3-pointers. They still both forced Purdue to score below their season average points per possession against high major teams.
Remove the game film, and KenPom could have still told us all this. As a general rule, a team with very low 3-point and assist rates allowed (orange color-coded) is a distinct drop team, and a team with very high 3-point and assist rates allowed (blue color-coded) is a distinct hedge team. Joining Illinois in heavy drops are teams like UConn, Alabama, and Creighton, and defenses that have a KenPom profile that looks like Houston includes Texas A&M, Baylor, and Ole Miss.
The reason we know this is simple. Like in the Swain against Illinois clip, strict drop coverages want to allow dribble attempts inside the 3-point line, so they'll funnel ball handlers to exactly where they want them to go. This both dissuades 3-point attempts and passes at the same time. The most extreme example of this was how the Utah Jazz defended prime James Harden with poor perimeter defender Ricky Rubio and excellent rim protector Rudy Gobert. (No one has done this in college basketball, at least yet).
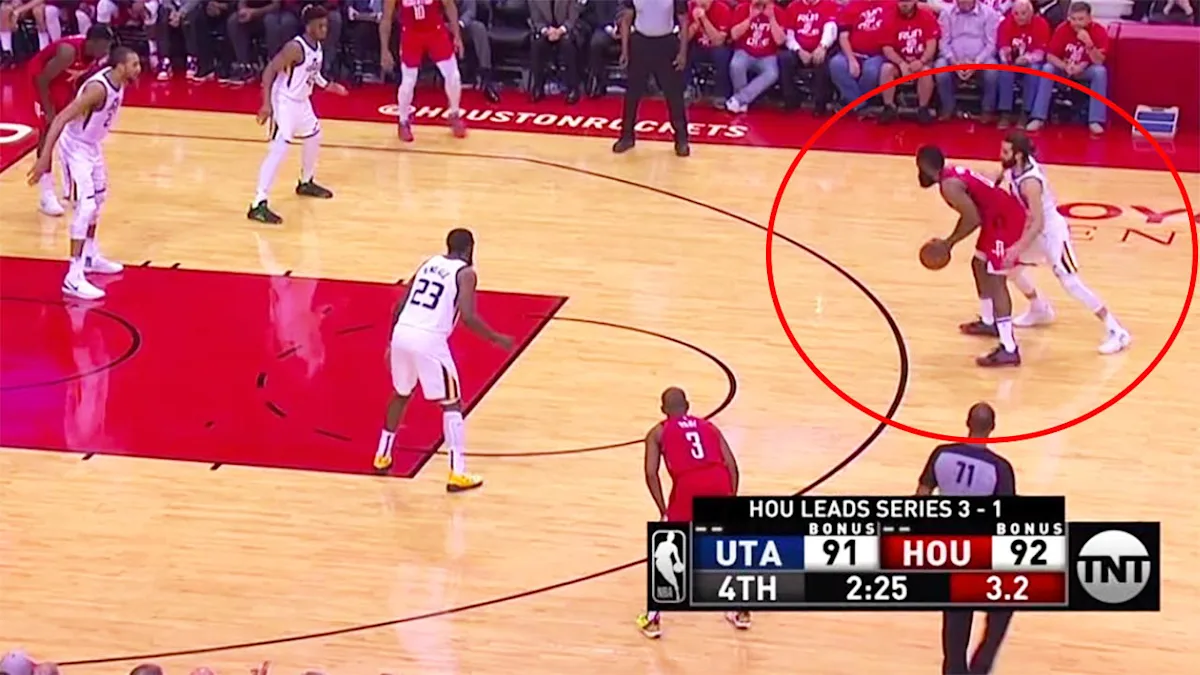
Look at that picture, and tell me how Harden is supposed to shoot a three or make a pass in that situation! Hence the low rates for drop coverages in those areas.
On the flip side, high 3-point and assist rates are to be expected in a hedge scheme, because the constant double-teaming and rotations simply force passes across the floor. With the defense in rotation, the obvious emphasis is on defending the rim, hence the immediate aggressive double on Handlogten in the Houston clip. With double-teams and intentional rim denial, the hardest thing to take away is a 3-pointer off a pass, hence why those numbers are so high.
In regards to the four factors, one should assume a drop will have extremely low turnover rate because of the lack of pressure, and very strong defensive rebounding rate because the big man is usually in excellent position parked in the key. To the contrary, hedges are going to forces tons of turnovers because of on-ball pressure, and allow more second chances because of scrambled positioning after all the switches. It's no surprise that Illinois is 360th in turnover rate and 21st in defensive rebounding, while Houston is 24th in turnover rate and 116th in defensive rebounding.
Because hedge is a lot harder to execute, you won't see too many teams implement that style. However, drop coverage has become wildly popular in the analytical era of college basketball, since it does such a good job of limiting 3-point attempts and ball movement. However, teams have chosen very different ways to defend the back end of a drop. To demonstrate this and how we can decipher it through KenPom, we'll keep Illinois' profile and replace Houston with UConn.
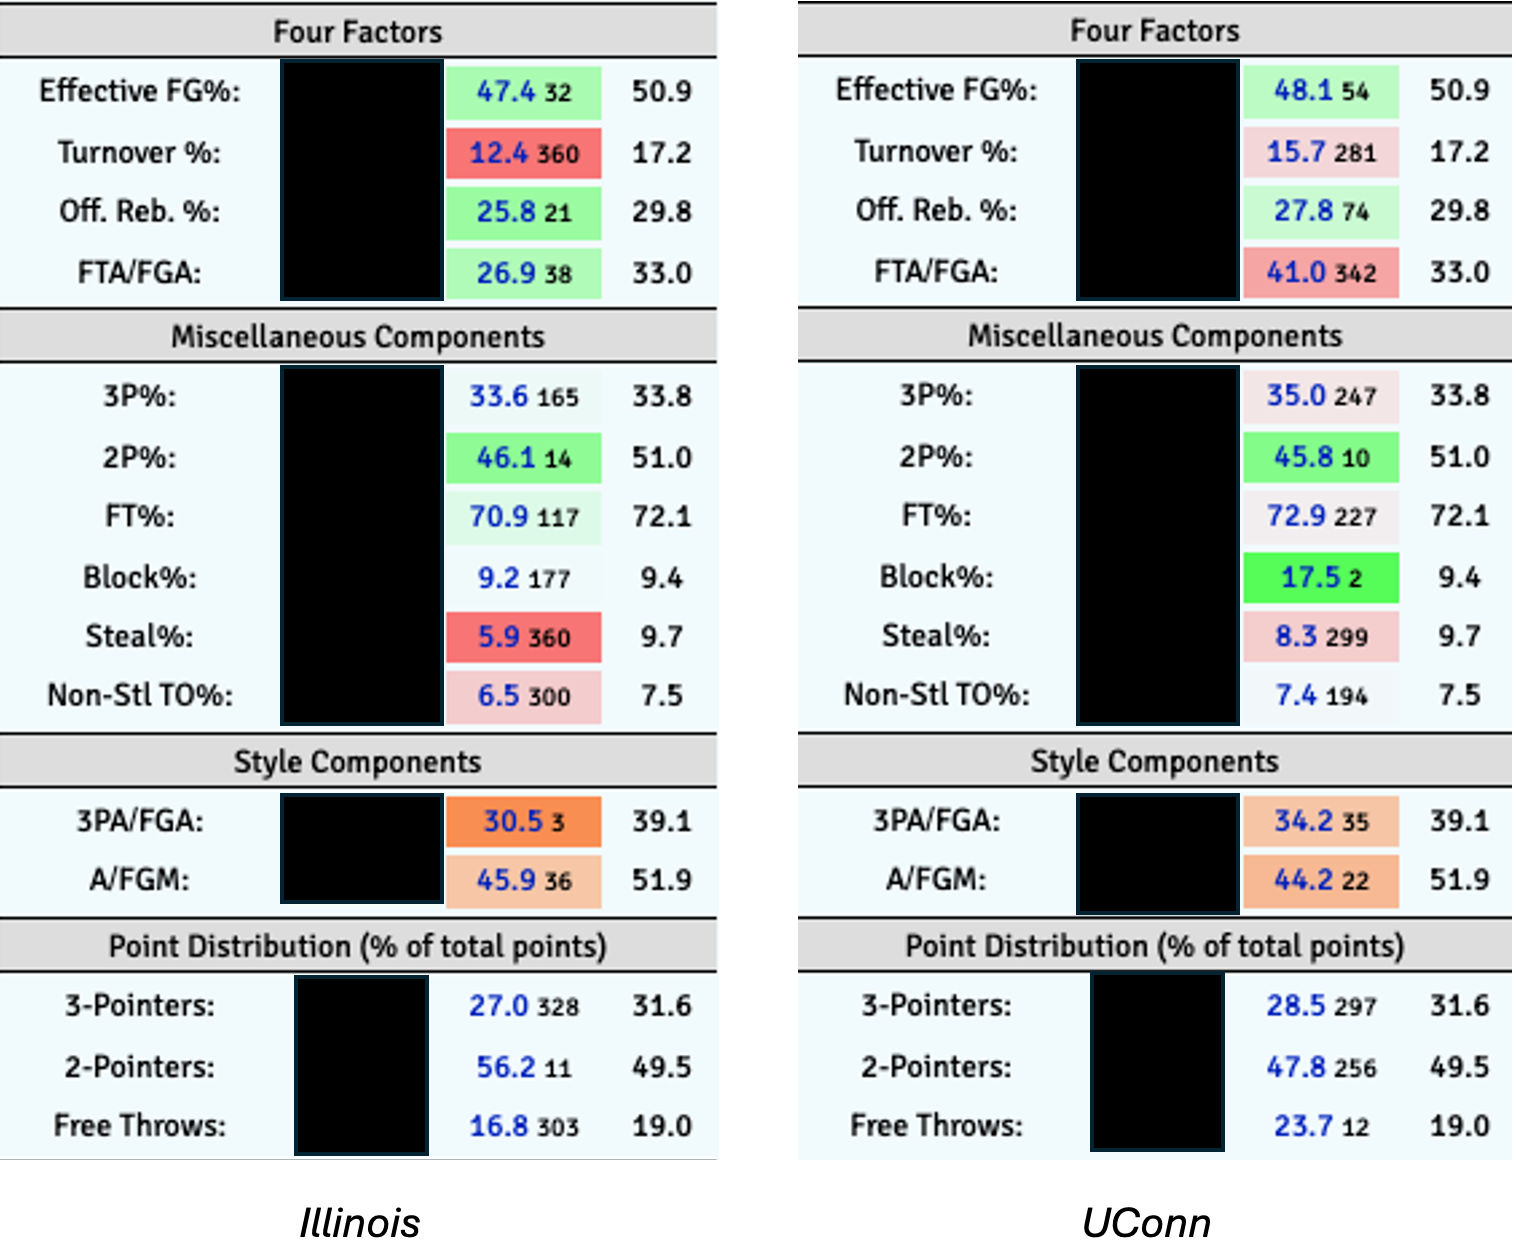
While both teams have similar 3-point and assist rates, while also doing an elite job of defending twos and a poor job of picking up steals, everything else is different. Illinois is 38th in allowing free throws, and UConn is 342nd. Illinois is 11th in allowing points on 2-pointers, and UConn is 256th. Illinois is 177th in blocked shot percentage, and UConn is second. This is all due to the pickup point and positioning of the big man. In the previous Illinois clip, Ivisic is guarding the restricted area like a fortress. Look at what UConn does when in the same position with Swain.
The Huskies allow Swain to get all the way to the hoop, but because they have one of the best shot blockers in the country with Samson Johnson, and the drop allows him to be in a desirable position and he's able to easily block the attempt. This explains the significantly higher block percentage than Illinois, but it also explains the inflated free throw attempts number due to the higher amount of rim contests UConn has on a per-game basis.
In summary, here are some of the conclusions you can typically take away from defenses based off their KenPom profile:
Low 3-point rate, Low assist rate, Low free throw rate: Mid-range heavy drop coverage
Low 3-point rate, Low assist rate, High free throw rate: Rim funnel drop coverage
High 3-point rate, High assist rate: Aggressive hedge/double-team coverage
High 3-point rate, Low assist rate: Switching or sagging coverage
Personnel
The last tab on KenPom's team scouting report is a handful of very interesting notes on a variety of factors. To finish up, we'll go rapid fire through each of the stats.
Bench Minutes: Simply the percentage of total minutes that a bench players across the whole season. This is a particularly notable stat when a team is facing an opponent that is very adept at getting to the free throw line. What happens if a team with no bench gets in foul trouble?
D-I Experience and Minutes Continuity: One of these is increasing in importance and one is lessening. 10 of the top 11 in D-I experience made the NCAA Tournament last year, and nine of them were single-digit seeds. All of the 1-seeds were No. 128 or better, even freshman-heavy Duke. Only two teams ranked below 300 made the Big Dance.
To the contrary, 19 of the top 25 teams in minutes continuity underperformed their preseason KenPom ranking, while 16 of the bottom 25 teams in that stat overperformed their preseason slot. While KenPom seemingly adjusted his numbers to make up for this fact, it's still worth noting.
Average Height: Just interesting. Cool to reference when No. 16 Fairleigh Dickinson knocked off No. 1 Purdue as the nation's shortest team (by far).
2-Foul Participation: Now this one DOES mean something, especially following an exhibition season where referees have been calling fouls at extreme rates, and blowing play dead for initial contact is a point of emphasis for officials. This stat is able to determine the percentage of minutes a player is on the floor for in the first half with two fouls.
Last season, a super banged up and undermanned Tarleton State team led the country by a fair margin at 74.6%. Radford was last nationally at 0.8%. The discrepancy is massive. Keeping players on the floor with foul trouble is considered as an analytically-advanced, new-school approach. This is why coaches like Eric Olen, Pat Kelsey, Todd Golden, Kyle Smith, and Josh Schertz rank near the top, while coaches like Rick Pitino, Mick Cronin, Brian Dutcher, and Fran McCaffery rank near the bottom. Poor Oziyah Sellers is going from a program that would keep him on for an average of 31% of team minutes with two fouls, to one that would do so for 1.5% of minutes.
