

To kick off this deep dive, let us start with two assumptions. Assumption one is that you, valued reader at Basket Under Review - a college basketball-only website - is a college basketball fan. Assumption two is that as a college hoops head, at some point in time, at some level of capacity, you've heard of KenPom.com.
We can make this assumption because there is no bigger or more influential statistics source in the sport than the website started by Ken Pomeroy in 2004. His net rating statistic is used by the NCAA Tournament's selection committee to help seed and rank teams for March Madness. And his endless array of advanced analytics has been used by everyone from broadcasters and fans, to D-I programs and coaches (some bigger fans than others).
While KenPom has a ton of different elements and subsections (including some fun miscellaneous ideas like game rankings and referee ratings), the main areas can be broken up into four prongs: Team Stats, Player Stats, Team Rankings, and Individual Game Box Scores. Team rankings are perhaps the most referenced piece of KenPom, but they're relatively straight forward - essentially points scored per 100 possessions minus points allowed per 100 possessions adjusted with weights for things like opposition quality and game location. Box scores may be even simpler, outside of some slight tweaks, they don't look much different than the typical box score for a typical basketball game.
Team and player stats are far more nuanced and complicated. Even though some conclusions can be deduced on a KenPom page from the most untrained eye, understanding how all of the rate stats and efficiency ratings work can be a tough task. The goal of this breakdown is to better understand what KenPom stats are actually saying, and how to use them to take away more information from players and programs. Here, we'll focus specifically on a player's season-long box score.
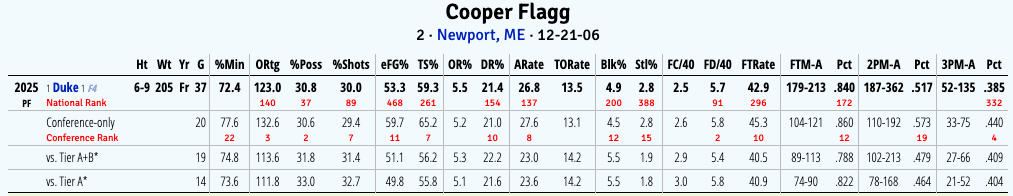
To begin, we'll take a look at Cooper Flagg, the best player in the country last season in real-life accolades and the KenPom Player of the Year ranking. There are some very quick deductions that can be made at first glance. Flagg's from Newport, Maine. He was nationally ranked in the top-500 of all but five statistical categories last year. He took a big offensive leap in ACC play, with his offensive rating, effective field goal, true shooting, 2-point, and 3-point percentages all soaring.
However, there are other takeaways within this data that may be slightly less obvious. This profile suggests Flagg probably took a significant portion of his shots off the dribble. He was likely tasked with guarding multiple positions defensively, or potentially played in a hyper-aggressive or switching scheme. He seemingly led a lot of transition breaks on his own as both a rebounder and initiator.
Of course, many of these "hidden" takeaways were already well-known when it comes to the eventual No. 1 pick in the 2025 NBA draft. But if you can apply that same logic to Northwestern State's Addison Patterson, or Queens' Leo Colimerio, who maybe you haven't been able to get substantial eyes on, then suddenly you start to learn a whole lot about players.
Possession Percentage and Shot Percentage
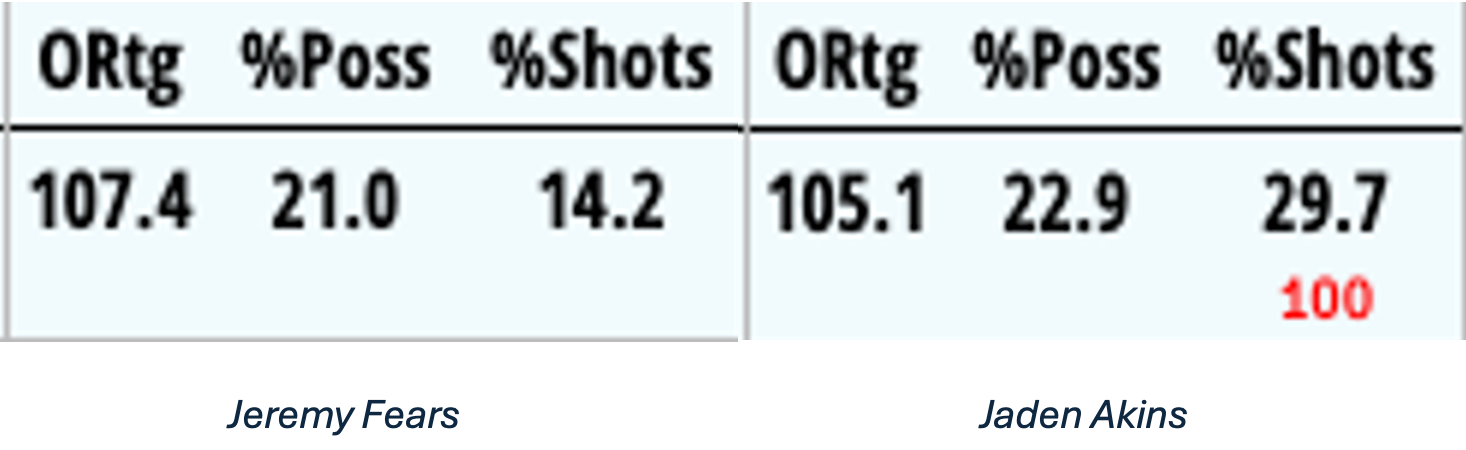
Above are two players that both started every game they played in for last season's Elite Eight Michigan State squad. Jeremy Fears and Jaden Akins had very similar offensive ratings, both good, not great. They both posted approximately the same possession percentage, which means that a Michigan State play was finished by them around 22% of the time, each. And yet despite that, Akins took nearly a third of the Spartans' shots while he was on the floor, and Fears took just 14.2%, the lowest amount of any non-big on the roster.
This immediately indicates to us that Akins and Fears were both specialists - Fears as a facilitator, and Akins as a scorer. Going to the film and watching how each player handles an offensive set could determine this.
But if you didn't have the time, the access, or the desire to look at the film, their KenPom profiles would have told you this is how they play. Every other player on Michigan State's roster last year had a gap between possession and shot percentage of less than 3%, while Fears and Akins were both more than double that.
The reasons for this are evident in their profiles. Fears was eighth-nationally in assist rate, which naturally brought a sizeable amount of turnovers, and those count towards possession percentage. His ability to dribble with the ball on a string and remain in control also allowed him to draw an unusually high amount of fouls, as his 78.8% free throw rate would have ranked first amongst all guards nationally had he played another 40 minutes to qualify for the leaderboard. When you consider that 23% of Fears' possessions ended in a turnover, and nearly eight of every 20 attempts Fears took was a free throw, which counts towards possessions and not towards shots, that wild gap makes sense.
On the flip side, despite having the highest possession usage on the team, Akins had the second-lowest turnover percentage and lowest free throw rate. This informs us that not only was his role rarely to distribute to others, but his high-usage shot diet suggests he had a propensity for pull-up jumpers before reaching the rim, where he's more likely to draw fouls.
In total, approximately 37% of Michigan State possessions ending with Fears resulted in a field goal attempt, while around 80% of possessions ending with Akins concluded with a shot from the floor.
These are two dramatic examples of how a KenPom player stat page can succinctly determine player role in a matter of seconds, but general themes typically lend themselves to certain types of players, such as:
High-Possession%, High-Shot%: On-Ball Player
Shot% higher than Possession%: Score-First Player
Possession% higher than Shot% with high AST%: Pass-First Player
Possession% higher than Shot% with low AST%: Off-Ball Player
Every team has their own variation of roles, but using this concept with a team's starting five can help clarify how everything blends together.
Offensive Rating and Usage
Offensive rating is the most complex equation on a KenPom player profile, one that Pomeroy says "is very complicated, but accurate." While no other information is given on what's inside the formula, one can pick their way through the different elements like Guy Fieri trying to guess what's in a pitmaster's secret rib rub recipe (or you can just buy Dean Oliver's book, Basketball on Paper). Shooting efficiency along with assists and turnover rates likely make up the bulk of the numbers. But what's more important than the offensive rating itself is understanding the context of a player's role within it.
Pomeroy himself says as much on his overall player stats leaderboard, where four Top-100 lists sit for offensive ratings: At least 28% of possessions used, at least 24% of possessions used, at least 20% of possessions used, and all players. Here's the average of those players' ratings.
28%+ Possession Rate: 107.2 O-Rating
24%+ Possession Rate: 117.7 O-Rating
20%+ Possessions Rate: 122.4 O-Rating
All Possession Rates: 129.2 O-Rating
Of course, a part of the gap is due to a significantly smaller number of players that reach the higher possession rate thresholds, but as a general rule, players that take up fewer possessions are less likely to take inefficient shots or make aggressive plays that could lead to turnovers.
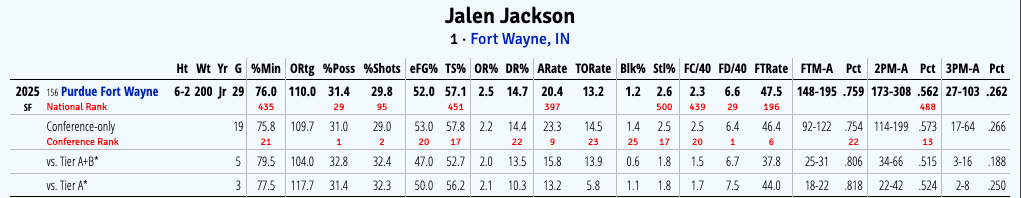
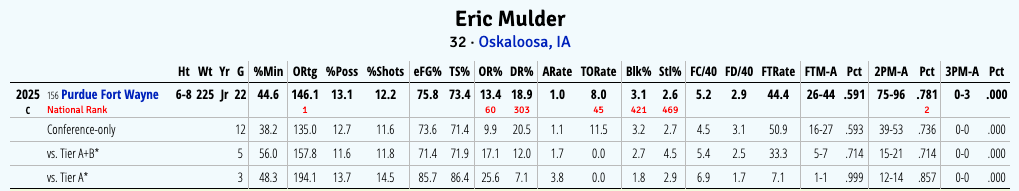
To illustrate this, we'll take a look at Purdue Fort Wayne's starting guard and big last season - Jalen Jackson (now at Butler), and Eric Mulder (now at Iowa State). Mulder led the entire country in offensive rating, on extremely low usage, while Jackson was just seventh on his own team while using the most possessions in the entire Horizon League. However, it was Jackson that was ranked as the single-best player in the conference according to KenPom.
Understanding role is a massive part of diagnosing offensive rating. Mulder truly never had the ball in his hands last year, he had a grand total of four assists, 11 turnovers, two drives, four jump shots, and two non-rim two-point attempts. Meanwhile, Jackson had 97 assists, 69 turnovers, 164 drives, 119 jump shots, and 85 non-rim two-point attempts.
By a pure offensive rating standpoint, Mulder was the better player. But by all other accounts, Jackson was the more effective offensive player. In fact, there's a deeper argument to be made that Mulder was bad offensively. Of the five players with a true shooting percentage over 70% with a shot percentage under 15% and an assist rate under 5% (true low-usage bigs, like Mulder), four of their teams were better offensively in league play when they were off the floor. Meanwhile, Jackson had the 2nd-best RAPM in the Horizon League, a stat created by CBB Analytics to help measure a player's impact on the court.
This is obviously no perfect science, but a general rule is that if a player with 28%+ possession usage has an offensive rating above the top-100 average amongst those players (Jackson's 110 is higher than the 107.2 average), they are a very good offensive player. Meanwhile, if a guy has an extraordinarily high offensive rating on very low usage with practically nothing in the assist and turnover categories, chances are they're actually not that effective of an offensive player.
Defensive Rebounding is a Team Stat
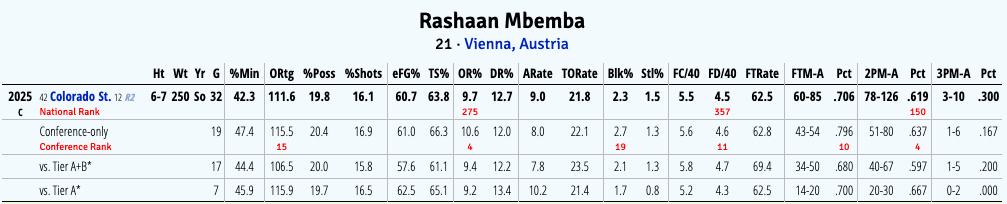
Meet Rashaan Mbemba, the starting big man on an elite Colorado State team that almost made the Sweet 16 last season. While a little short for the 5-spot, his burly 250-lb frame allowed him to be the fourth-best offensive rebounder in the Mountain West by percentage. However, he isn't even listed in the conference's Top 25 for defensive rebounding percentage. Does this mean he's a bad defensive rebounder?
No, not at all. That's because defensive rebounding rate is often not indicative of a good or bad rebounder. Pomeroy says as much in his explanation of the stat, mentioning, "it is generally believed that offensive rebounds are more attributable to individual effort than defensive rebounds."
In Mbemba's case, his low defensive rebounding rate is due to an extraordinarily high one from Colorado State wing Nique Clifford. Clifford's 26% mark was 24th-nationally last year, and first amongst wings. Considering Mbemba played 91% of his minutes with Clifford, his defensive rebounding opportunities were way fewer than nearly every other big man in the country. Take a look at Mbemba (No. 21) on some of Clifford's rebounds last year.
In all three instances, Mbemba is in good rebounding position, and the ball bounces in his general vicinity. But in all three instances, the ball ends up in the hands of Clifford. A part of this is likely by design, as Clifford is a much better on-ball transition player and an excellent passer. But that should not take away from Mbemba's rebounding ability.
So what's a better way to measure defensive rebounding? We could take the advanced approach with on/off numbers. Those suggest that Colorado State's defensive rebounding rate was 2.9% better with Mbemba on the floor versus off, which is an 80th% mark according to CBB Analytics. To dive deeper, the Rams' defensive rebounding rate with Mbemba and no Clifford was even better than when the two shared the floor, though that was in a small 95-possession sample size.
But in reality, the logic is simple. Mbemba was the starting big man for the 22nd-best defensive rebounding team in the country, by percentage. This means he was usually tasked with boxing out the opponent's best offensive rebounder, and he typically did a good job. And Mbemba's elite offensive rebounding rate, especially on a team that was in the bottom-third in team offensive rebounding, suggests that he's actually quite strong on the boards.
This is not a one-off phenomenon. Northern Colorado's Brock Wisne, Saint Mary's' Mitchell Saxen, and Yale's Samson Aletan were all examples of players with surprisingly low defensive rebounding rates on Top 25 defensive rebounding rate teams, while still posting strong offensive rebounding numbers and being positive defensive rebounding on/off contributors.
Assist Rate and Turnover Rate are not AST-to-TO Ratio
One of the most common misconceptions about KenPom player stats is that assist rate and turnover rate are the same as assist-to-turnover ratio. It's actually not close. Assist rate is a somewhat team-dependant stat, it's the amount of field goals a player assists on the floor, divided by the amount of total field goals made when the player is on the floor. That means nation-leader Moe Odum assisted on 44.3% of Pepperdine's field goals when he was on the court.
On the flipside, turnover rate is entirely individual, and "can be highly dependant on context," per KenPom. It is simply the percentage of total possessions that end in a turnover. Because of this, players that shoot far more than they pass will often have a deflated turnover rate, while players that pass more than they shoot will have an inflated one.
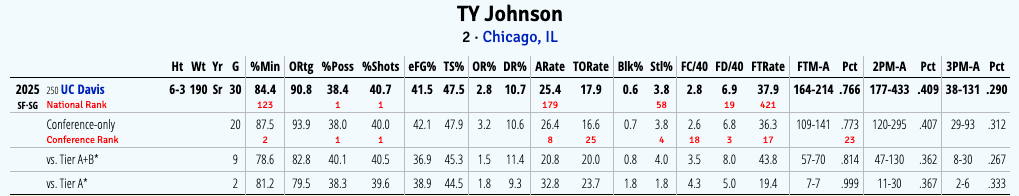
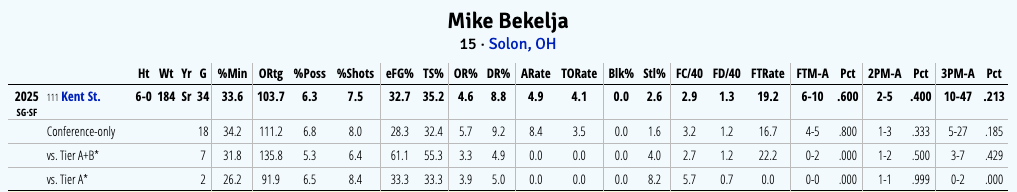
So that leads us to our comparison of UC Davis' TY Johnson and Kent State's Mike Bekelja. Johnson led the entire country in possession and shot percentage, while Bekelja had the third-lowest usage rate amongst players that saw 500+ minutes last year. Despite Johnson's assist rate being 7.5% higher than his turnover rate, Johnson was a rare on-ball guard who actually had a negative assist-to-turnover ratio. On the flip side, despite Bekelja's miniscule 0.8% gap, he led the nation in assist-to-turnover ratio by a very wide margin.
The reason for this is pretty simple. Johnson had the ball in his hands so much, that a very small 22.3% of his baskets were assisted on. Between that and the significant defensive attention he saw as the nation's leader in usage, a significant amount of UC Davis' assists were bound to come from him, even if he was predominantly a score-first player. His turnover rate is moderate despite leading the country in total turnovers because his exceptionally high possession percentage dropped the weight of the turnovers in the equation. The opposite is true for Bekelja, who only made two unassisted field goals all year. He was so invisible offensively and did such a good job limiting turnovers that both of his rate stats are practically nonexistent.
For many non-Bekelja low-usage players (who don't turn it over an unfathomable two times in 516 minutes), their turnover rates are actually inflated. DePaul's Conor Enright is a good example of this. He had a whopping 29.8% turnover rate, but because he was an extremely pass-first player who nearly had as many assists as field goal attempts, turnovers were just inherently going to take up a larger percentage of his overall possessions.
Final Miscellaneous Notes
- Defensive rate stats are similar to defensive rebounding rate, in the sense that they can be very situation-based. Some guys have inflated numbers due to a zone, or extreme help-heavy defensive scheme. Some guys are overly-aggressive on that end and are massive defensive net-negatives in lineup data.
- Fouls charged have elements of nuance as well. UConn allowed amongst the highest rates of rim attempts defensively last year, so it's no surprise that big men Samson Johnson and Tarris Reed fouled so much that they both would have fouled out on average in a full 40-minute contest.
- As a personal rule, I throw a caveat for on/off lineup data if a player was on the floor for more than 80% or less than 20% of a team's minutes, for sample size purposes.
